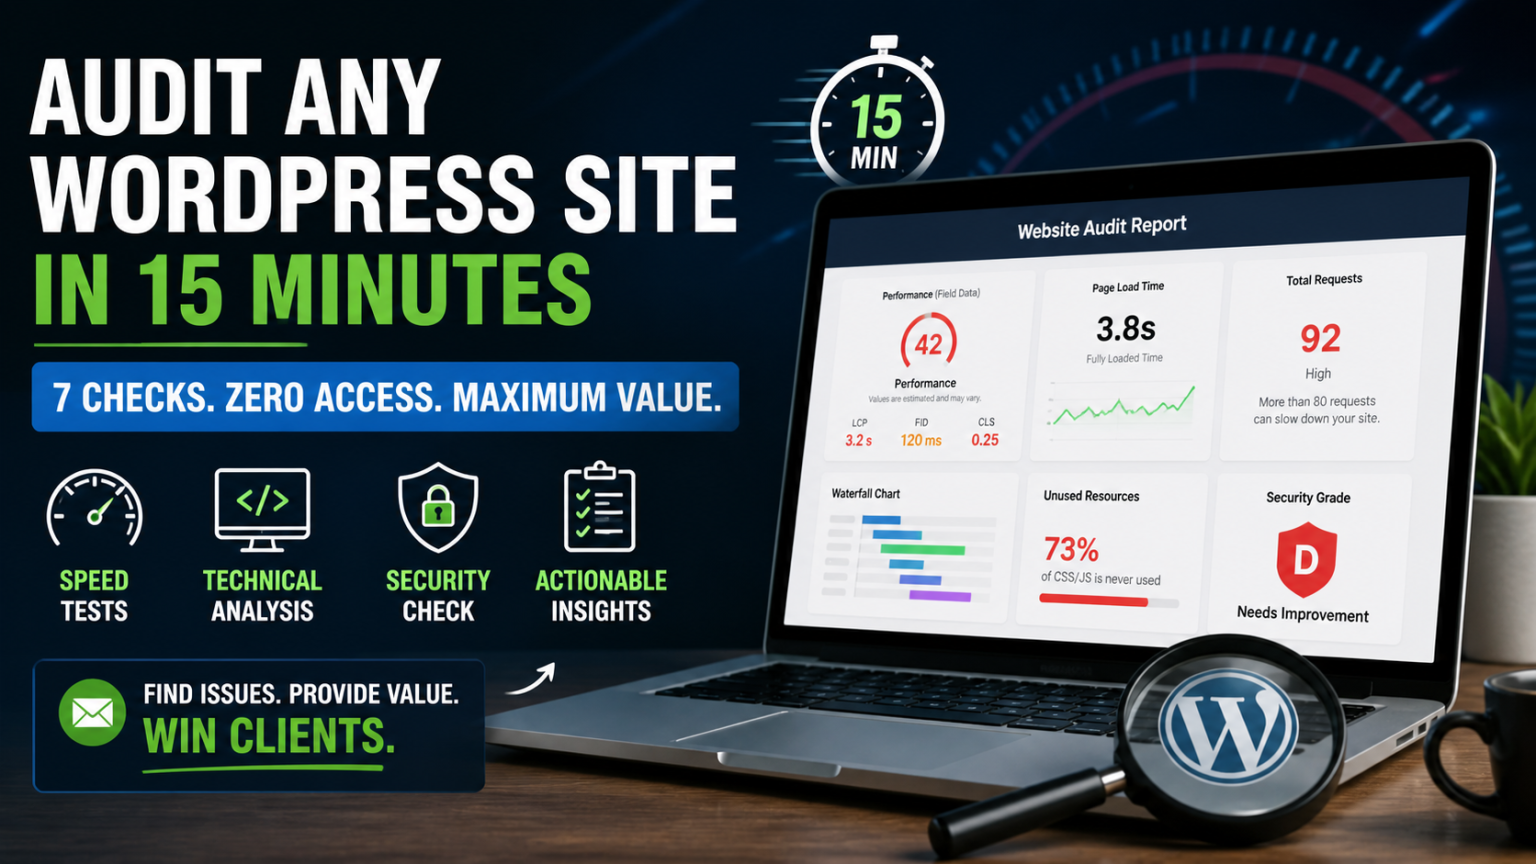
Keeping WordPress fast is essential for user experience, SEO, and conversions. A slow website drives visitors away and lowers your rankings. The challenge? Most performance issues hide behind plugins, hosting, and front-end assets—and you often don’t have access to fix them directly.
The good news: you can audit any WordPress site in about 15 minutes using only your browser. No login. No SSH. No developer tools beyond Chrome.
This guide walks you through a proven 7-step process to quickly identify performance and security issues on any site.
1. Check Real User Performance (Field Data)
Start with a speed testing tool like PageSpeed Insights.
- Enter the website URL
- Focus on Field Data, not Lab Data
- Look at:
- Largest Contentful Paint (LCP)
- Cumulative Layout Shift (CLS)
👉 If LCP is red (above ~4 seconds), you’ve already found a major issue.
Why this matters: Field data reflects real users—and that’s what search engines care about.
2. Detect Plugin Bloat (Network Requests)
Open Chrome DevTools:
- Press F12
- Go to Network tab
- Reload the page
Now check:
- Total number of requests (bottom of screen)
👉 Over 80 requests = likely plugin bloat
Sort by Size and look for:
- Huge images (especially hero sections)
- Large CSS/JS files from page builders
Fix idea: Reduce plugins, optimize images, and remove unused features.
3. Find Unused CSS & JavaScript
In DevTools:
- Press Ctrl + Shift + P
- Search for:
Coverage - Click Start Coverage
- Reload the page
You’ll see how much code is unused.
👉 Many sites waste 60–80% of loaded CSS/JS
Why this matters:
- Browser downloads everything
- Even unused code slows down load time
Fix idea: Use lighter themes or disable unused components.
4. Identify the Biggest Bottleneck (Waterfall)
Use a tool like GTmetrix or similar.
- Run the test
- Open the Waterfall tab
Look for:
- The slowest loading file
Common issues:
- Large hero images
- Blocking JavaScript
- External scripts
👉 One file can delay your entire page.
Fix idea: Compress, lazy-load, or defer that resource.
5. Test Server Speed from Multiple Locations
Use a tool like WebPageTest.
- Test from multiple locations
Compare TTFB (Time to First Byte):
- Fast in one region, slow in another?
👉 That’s a server or CDN issue, not a code issue.
Fix idea:
- Add a CDN
- Upgrade hosting
- Optimize server configuration
6. Analyze the Tech Stack
Use a tool like BuiltWith.
Enter the URL and check:
- CMS (WordPress, etc.)
- Plugins/tools
- Analytics scripts
- CDN presence
Red flags:
- Multiple tracking tools
- No CDN
- Too many third-party scripts
👉 Every external script adds delay.
Fix idea: Consolidate scripts using a tag manager.
7. Check Security Headers
Run the site through a security header checker.
Look for missing headers like:
- Content-Security-Policy
- Strict-Transport-Security
- X-Content-Type-Options
👉 Many websites score very low (often F)
Why this matters:
- Protects users from attacks
- Improves trust and compliance
Fix idea: Add headers via server config or a security plugin.
Turn This Into Clients (Freelancer Hack)
This method works on any website, not just your own.
Try this:
- Find a local business (restaurant, gym, clinic, etc.)
- Run all 7 checks
- Take screenshots
- Send a simple email:
“I found a few speed and security issues on your website that may be affecting performance and user experience. Here’s what I found and what it means.”
No pitch. No pricing.
👉 Just value.
This approach builds trust and often turns into paid work—without cold outreach.
Conclusion
You don’t need access to a WordPress dashboard to diagnose performance issues.
With just a browser, you can:
- Identify slow loading elements
- Detect plugin bloat
- Find unused code
- Spot server issues
- Analyze tech stack problems
- Improve security
And you can do it in 15 minutes or less.
Whether you’re optimizing your own site or looking for new clients, this process gives you a fast, reliable way to uncover real issues—and fix them.
Pro Tip: Turn this into a repeatable checklist and you’ll never run out of optimization opportunities.